Thursday, 10 April 2014

Further sea ice shenanigans


Saturday 5th April 2014 
(post by Kim)

Well our predictions from yesterday were correct, and as we travelled southeast to the second mooring site the sea ice became thicker and more compacted, so that most of the day we’ve been slowly ploughing our way through solid pack ice. It’s been an incredible experience, watching the ship churn up thick blocks of ice, with the flat snowy landscape stretching out in front as far as the eye can see. The local wildlife seem to appreciate the clear strip of water that the ship leaves in its wake, and we saw troops of Adélie penguins lined up in single file to dive in, and the fined backs of a few Minke whales following alongside us. There was even (drumroll please!) a brief sighting by Hugh of a distant Emperor Penguin, which was amazingly exciting, as it’s not usual to see them this far north!


The bow of the JCR, ploughing through compacted pack ice (above). The view of this churned and broken up pack ice as we pass through it reveals brown layers at the base of the ice (below, photo courtesy of Ollie) which are actually layers of diatoms – microscopic organisms that make their shells out of silica – living within the ice. 


We successfully reached the second mooring site without incident, and although the extent of the pack ice made it impossible for us to release and find the mooring that was already there, we were able to deploy a new mooring that will continue to make observations for several years to come. Just as the new mooring was being lowered into the water from the back deck crane, a Minke whale breached the surface just behind the ship. Those of us clustered around the UIC windows to watch the deployment were blown away, and I can’t imagine how amazing it was for those out on deck! Another amazing experience, and another spectacular day in the Southern Ocean (with some successful science thrown in too!).

The perfect moment captured by Jesse. A Minke whale breaches right by the mooring team hard at work on the freezing deck!


Tuesday, 8 April 2014

Ice Ice Baby!


(Friday 4th April 2014 - post by Kim)

Greetings from the frozen edges of the Weddell Sea! Today we’ve all been experiencing the chills and thrills of finding ourselves back amongst some truly spectacular Antarctic scenery, as the ship steamed into extensive sea ice for the first time this cruise. Our mission: to recover a set of moored scientific instruments that have been anchored close to the sea bed for the past three years. During that time they’ve been recording information about the temperature, pressure, and salinity of the water, as well as measuring the direction and velocity of currents, to add to a ten year time series. The battery life of the moorings is only four years, so it’s our job to scoop them up and discover what exciting new information they have to tell us about the movement of water in the Weddell Sea.


The iced over forecastle of the JCR. With temperatures starting at -14degC and dropping to -22degC by nightfall, stepping outside today has required more than just a thick jumper. Many thanks to Ollie for braving the cold to get the wonderful photos for this blog post.


We started the day at a comparatively balmy -14 ºC, with the sea surface temperatures hovering just above freezing (which for sea water at the surface is -1.8 ºC). This large temperature gradient between the air and the sea causes the air close to the sea surface to warm and pick up moisture. As this air rises and cools, the moisture re-precipitates a metre of so above the water, an effect known as ‘sea smoke’, which creates an amazing, slightly eerie view in the morning light. As the day progressed we had a perfect opportunity to pass through the various stages of sea ice formation and growth, as the air temperature steadily plummeted and we made our way southwards.

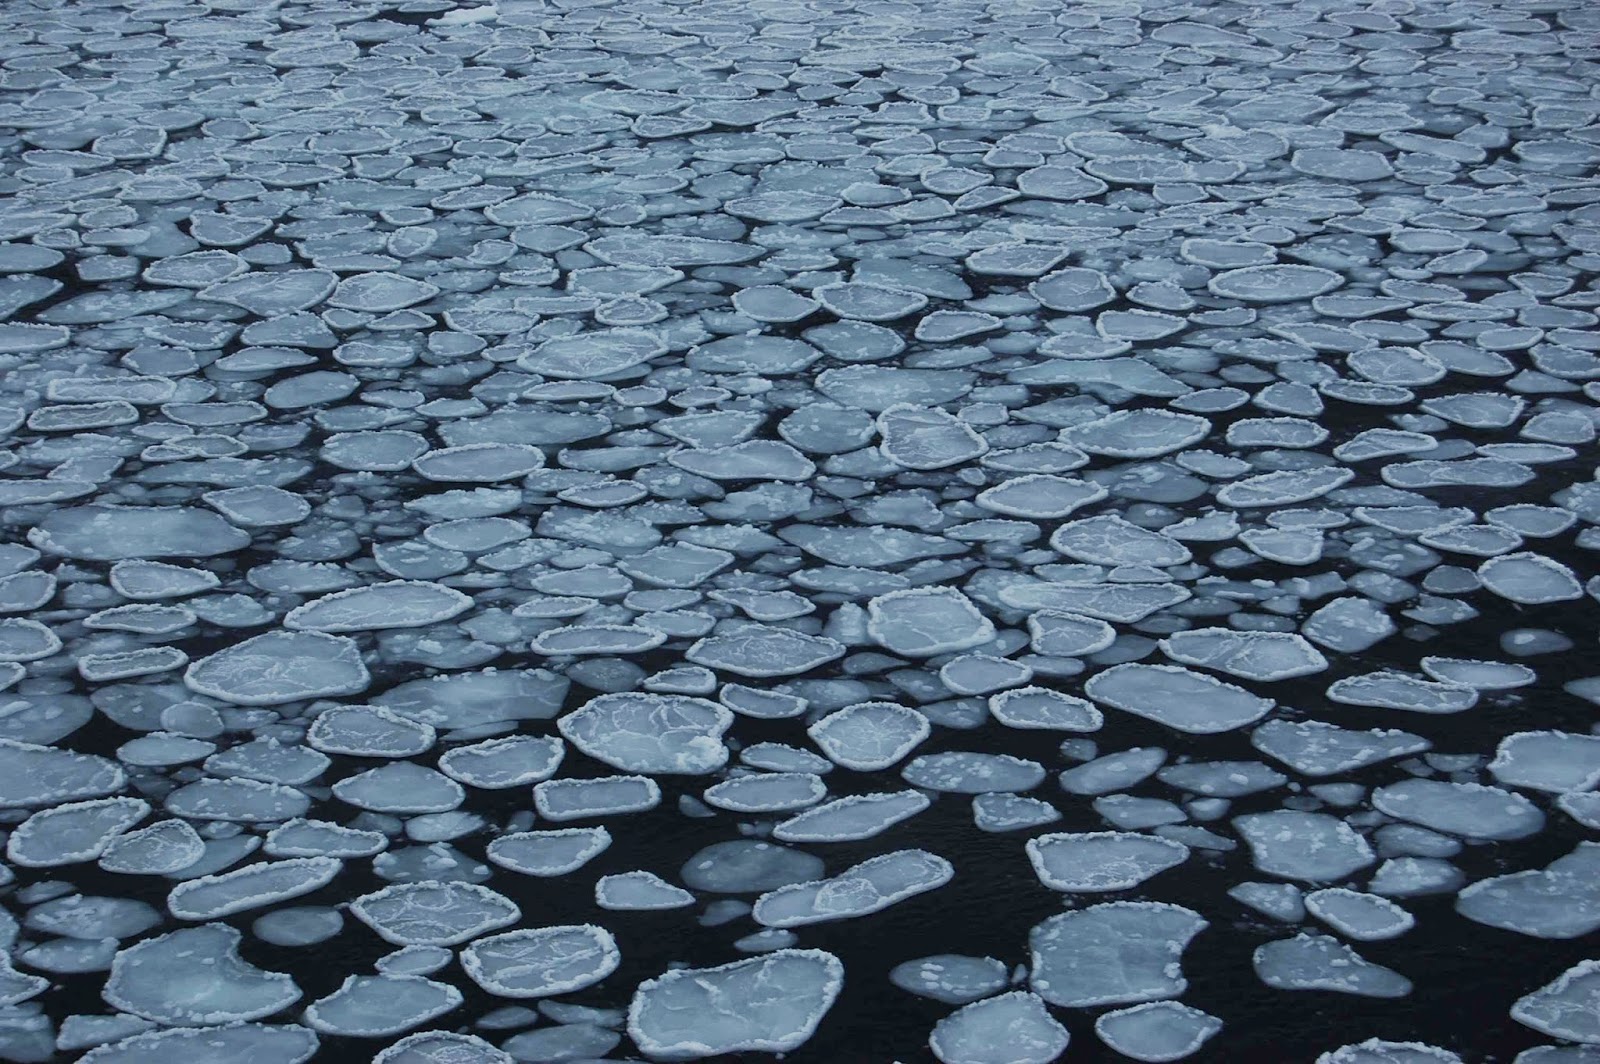
In these conditions, the sea surface steadily loses heat to the colder air above, and eventually patches of it reach -1.8 ºC and begin to freeze. These small initial patches of sea ice act as buffers; they damp down the waves and reduce mixing at the sea surface, enabling larger areas of surface water to cool down to freezing point. As the very surface layer of water freezes it forms ‘grease ice’ which, as the name suggests, looks like a floating layer of oil or grease. This layer then compacts together into ‘frazzle ice’, and as the temperatures continue to drop, this compacts again into circular patches of thicker ice, appropriately known as ‘pancake ice’.

Grease ice forming amidst the sea smoke (above) and pancake ice (below).


By lunchtime we were steaming through a stunning landscape of pancake ice, punctuated here and there by larger, blocky icebergs. These blocks are the accumulation of several years of sea ice that have grown each season with the addition of fresh snowfall. Keen-eyed Andrew spotted some blocks that were at least twelve years old; a bit like tree rings, you can tell the age by counting the layers of snow accumulation, with every layer representing a winter of growth.

View of sea ice from the ship – sea smoke rising from patches of open water in the background, surrounded by pancake ice, and a large floe of multi-year ice.


Sea ice also is also a great environment for Antarctic wildlife. The ship has had a constant escort of Snow and Antarctic Petrels, and every now and then groups of Adélie penguins could be seen diving from larger floes of pancake ice. But what we were really looking for as we scanned the horizon with our binoculars was the tell-tale orange and yellow buoys that would mark the location of the moorings. Phil, our intrepid onboard moorings-master, had sent out a signal to the first set of instruments earlier in the day, instructing them to cut the wire that anchored them to the seafloor, and causing them to float up to the surface. After a tense half an hour or so the buoys were spotted sandwiched amongst the ice floes, and some excellent manoeuvring from Jerry and Phillipa up on the Bridge soon had us alongside. A little sophisticated grappling-hook action later (courtesy of our wonderful Bosun Dave - no mean feat in temperatures of -19 ºC with 20 knot winds whistling across the deck!) And the first mooring was safely onboard.

The yellow buoys marking the position of the moorings once they’d floated to the surface. The instruments and the buoys are attached together by sturdy cables, which Dave (the tiny figure top left) managed to snare with a grappling hook, and drag round to the back deck where it could be hauled aboard.


But our mission isn’t over yet – a second mooring still awaits collection further to the southeast, in an area of the sea much more thoroughly iced over. The floes of pancake ice that we’ve been encountering all day are steadily growing, sticking together and compacting until they form continuous sheets of pack ice. Even the ice strengthened hull of the JCR can only get us so far in conditions like these, so everyone’s keeping their fingers crossed that the ice around the second mooring won’t be too thick, so that we’ll be able to get in to retrieve it.

In the meantime, even the most Antarctic-seasoned scientists and crew are enjoying the beautiful views afforded by traversing these icy waters, from a spectacular sunset over the ice, to a breathtaking starry night sky. Definitely worth bundling up in an insulated boiler suit (the height of polar fashion) and daring the -22.6ºC for.

Monday, 7 April 2014

Data, data, everywhere!


One of the science cruise members is Ellen Bazeley-White who works as a Scientific Data Manager in the Polar Data Centre (PDC) at the NERC British Antarctic Survey (BAS). Ellen put together this blog (thanks Ellen!) post to explain what she does and as Ellen managed the BAS Archives Service for six years and has provided a brief history of BAS for the blog....

During the cruise I’m helping with the CTD sampling, but also recording information in digital event logs about the scientific events, the where, when, what and how type information about the data being collected. I work closely with the information technology staff (Jeremy and Pete) and engineers (Mark and Seth) to make sure all the data being collected is being saved and backed-up. The data and all the documents and logs created during the cruise are copied and taken back to BAS in Cambridge.

In addition to the BAS Polar Data Centre, data and records are also managed in the BAS Archives Service and I also have to be familiar with the older types of marine data collected by BAS such as sea-ice observations, met logs, paper echo sounding charts and also with ships records such as deck logs and voyage reports.

Ellen at Rothera


So, what exactly is ‘The British Antarctic Survey’

The British Antarctic Survey started as a UK government operation during the Second World War called Operation Tabarin.  The aims of the operation were to provide a British presence in the Antarctic to discourage enemy activity, to strengthen British claims to sovereignty of the Falkland Islands Dependencies [now South Georgia, South Sandwich Islands and British Antarctic Territory] and to make meteorological observations considered important to improving weather forecasting for British shipping in the South Atlantic Ocean.

In February 1944 two bases were established, at Deception Island (Base B) and Port Lockroy (Base A), the following year a base was established at Hope Bay (Base D). Scientific work carried out included topographical survey, geology, glaciology, biology, meteorology and sea ice observations.

During Operation Tabarin lots of film footage was taken. These original films along with many more documenting the history of BAS are held in the BAS Archives Service. In 2012 the Operation Tabarin collection was digitised in preparation for the 70th anniversary. Here is a short film clip of the building of Base A at Port Lockroy in February 1944.  You can see the boxes are marked with ‘A’ to get them to the right base, BAS still uses these base markings for cargo today, the ship in the background is the S.S. Fitzroy, the huts were of a prefabricated design and the carpenter is ‘Chippy’ Ashton.


Acknowledgement: http://www.nationalarchives.gov.uk/doc/open-government-licence/version/2/
Lewis Ashton, 1944. Reproduced courtesy of the British Antarctic Survey Archives Service. Archives ref. AD6/16/1944/1.1. Crown Copyright

After the war the organisation was named the Falkland Islands Dependency Survey (FIDS) and continued to undertake scientific survey and research. BAS staff that go South [to the Antarctic], especially people that winter at the BAS bases are still known as Fids. In 1962 the name changed from FIDS to the British Antarctic Survey (BAS) and in 1967 BAS came under the remit of the Natural Environment Research Council (NERC).

BAS still carries out scientific research, long-term observations and surveys that cannot be done by anyone else in the UK and provides the national capability for UK Antarctic science and logistics. As on ongoing organisation now over 70 years old, there is great value in the data and collections managed by the information services at BAS. As a publicly funded body, these value long-term data are available for all to access and reuse.

Over the years BAS has operated many bases, ships and aircraft, but currently operates five bases (Rothera, Halley, Signy, Bird Island and King Edward Point), four aircraft (one Dash-7 and four Twin Otters) and two ships (RRS Ernest Shackleton and RRS James Clark Ross, the ship we are currently on). In addition some of the old bases have been designated historic sites and are now managed by the UK Antarctic Heritage Trust.

More about BAS science, operations, data and collections, history and heritage can be found on the BAS website.

British Oceanographic Data Centre – http://www.bodc.ac.uk

Saturday, 5 April 2014

Of Peace and Science


(Thursday 3rd April) 

This morning we again went south of 60° latitude, and snow is falling thick and fast, covering the deck and filling our heads with Christmassy songs. 'South of 60' is a bit of a big deal. All areas south of this line of latitude are covered by the Antarctic Treaty, a successful international agreement to conserve the region. The Antarctic Treaty was formed in 1961 and designates the continent as a 'natural reserve devoted to peace and science', putting aside any territorial claims.

The Polar Front is where cold Antarctic waters meet warmer northern waters (and where we see lots of exciting physics), and acts as a kind of biological barrier, effectively making south of the Polar Front a closed ecosystem. Over the past 300 years the human activities have had considerable impact on the Southern Ocean. The whaling and sealing industries brought many species, such as the Antarctic fur seal, to the brink of extinction, while more recent commercial fishing threatened to damage the krill population. Krill are a shrimp-like organism that are a key component of the Southern Ocean ecosystem, as the snack of choice for whales, seals and birds. The Treaty was amended in the 1980s to extend protection over the Southern Ocean with the aim of conserving the unique marine environment and life. 

The Treaty also ensures that science is the main activity and the highest priority south of 60. Scientists from twenty seven nations currently work alongside each other on the continent, with the Treaty supporting the free exchange of scientific data and personnel. This is important as conducting science in such a remote and extreme environment is both expensive and logistically challenging. It is very exciting to be working in such an international and multidisciplinary area of science!


Siobhan and Hugh enjoying the southern weather 

Friday, 4 April 2014

All hands on deck!

Sorry for the slightly delayed news .... communication to the Southern Ocean is a little slow. However here is Tuesday's (1st April) dispatch!


We have been back at work today, catching up on those pesky few stations missed on the last leg due to bad weather. The seas are still pretty high today though pressure is on the rise and winds have dropped. The massive swell has knocked over anything not properly tied down; mugs, laptops and even heavy chairs have gone flying across the room. Despite closing the door to the sampling area waves have been forcing themselves in, flooding across the floor and overflowing into Andrew's wellies (he's not having much luck is he?). It has been (surprisingly) nice to be back at work and keeping busy. The JCR is a lovely ship and we have passed our free time with lots of films and games.... and yet we were all really enthusiastic to have something proactive to do!


Andrew and Ollie continue collecting those
oxygen measurements

The tracer team are busy back in the lab and Ollie has locked himself away with lots of samples to measure the dissolved oxygen concentration. On the CTD we have a sensor which can measure the concentration of oxygen in the water at a very high resolution. However, for us to have confidence in the numbers it gives us we need to calibrate it by taking water samples and measuring the oxygen concentration chemically. But why go to all this trouble? Why do we care about oxygen concentrations?

Firstly, it is interesting in its own right - it is thought that oxygen in the oceans is decreasing due to increasing temperature (less gas dissolves in warmer water) and increased stratification (less mixing means that less oxygen can be transported from the surface to depth). This is important because oxygen is used for respiration so changing oxygen concentrations will affect ocean biology.

Secondly, oxygen concentrations are often useful for defining water masses. Different types of water will have last been in contact with the atmosphere at different times and will have experienced different amounts of respiration and photosynthesis. This means that they may have very different concentrations of oxygen, helping us to identify the various types of water.

Thirdly, we can use oxygen to help to calculate the amount of carbon in the water which comes from a human source (anthropogenic carbon). We can't measure anthropogenic carbon directly because it is chemically identical to 'natural' carbon, but by estimating the biological and chemical processes the water has been through we can calculate anthropogenic carbon as the difference between what we would expect from these processes and the actual, measured amount of carbon. 


Tomorrow we will start steaming south for the moorings. The satellite images showed us that one of the mooring sites is currently covered in sea ice and it is creeping ever closer to the second. We have mixed feelings about this; having to go into the sea ice will be slow and take up precious time, and we really want to recover the moorings this year.... however we are all also a little excited the prospect of breaking though sea ice on the ship and being in amongst the penguins and whales again. 

(thanks to Ollie for his contribution to this post)
A dusting of snow in the Weddell Sea